First time with PerfHUD 5
So assuming you integrate the PerfHUD support code into your application, you'll see the following when you start up your app via the PerfHUD launcher. The default view is always the Performance Dashboard.
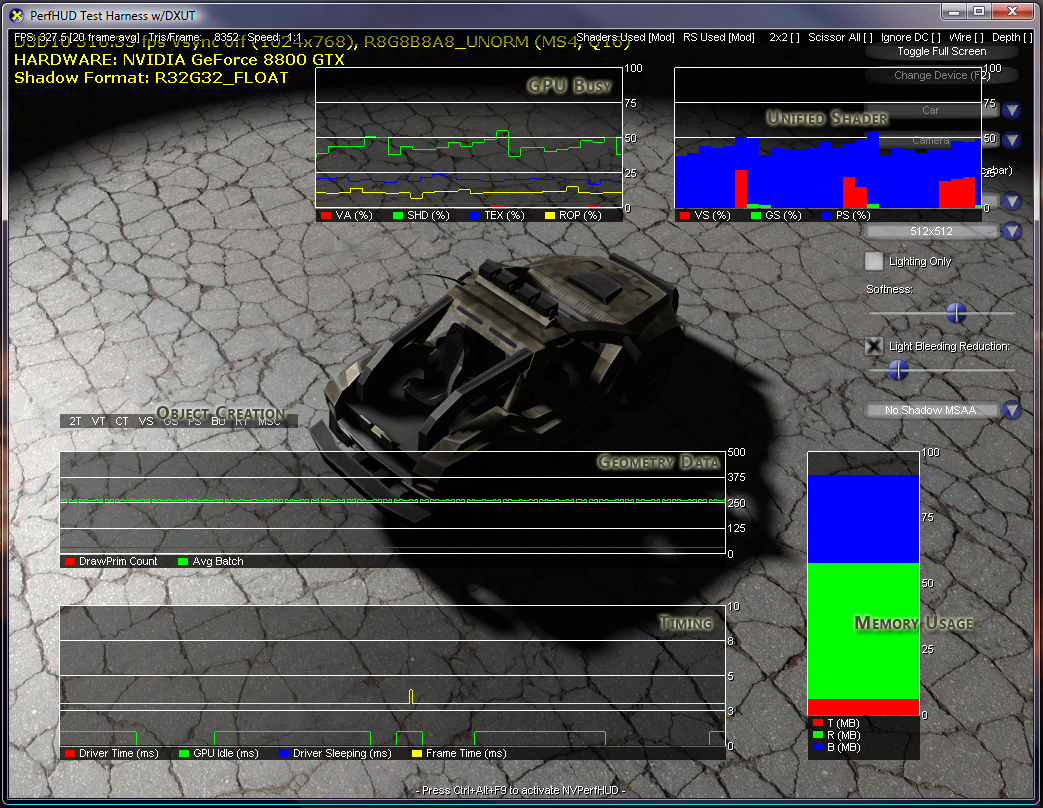
NVIDIA's default choices for the PerfHUD Performance Dashboard overlay cover the obvious bases in terms of performance analysis and debugging. The majority of our windowed 1024x768 viewport here is covered by graphs that tell you what's going on with the D3D runtime and how you're using (or abusing it), with what we assume is a focus on what you want to see most with D3D9. The small batch problem gets good coverage with the geometry data graph, which contains two signals that highlight where you are with your draw call budget and how big your geometry batches are.
How long the driver and GPU are spending rendering frames is a big consideration too, so you can see at a quick glance if you're maybe CPU limited (in two ways), or whether you're GPU limited, by checking idle times. Object creation gets a look in as well, letting you know if dynamic objects or surfaces are being created during a frame at runtime (they can kill performance in certain cases).
Then you have visual indications of basic execution parameters during runtime, including the shader load (VS/PS in D3D9, VS/GS/PS in D3D10), memory being used and how long the GPU's execution resources are busy for any given frame. The net result of the default overlays is that you have a reasonable set of useful signals displayed for analysis. However, given those signals might not be enough to look at what you're interested in for your analysis, NVIDIA wisely let you configure your own signal display and overlay layout.
Let's look at some specifics related to Andy's demo.