BenchmarksTheoretical RatesHere we'll take a look at the theoretical differences between the 7800 GTX 512MB board in relation to the 7800 GTX 256MB and the 6800 Ultra we're testing it against. To understand the theoretical rates, first the clockspeeds of each of the rendering domains need to be established.
Where, according to Rivatuner, the GTX 256MB board has the Pixel Engine (fragment pipelines) and ROP's running at 430MHz and the Geometry Engine at 470MHz, the newer GTX 512MB board sets all three domains at 550MHz. Applying these clock rates to the pipeline configurations, we can determine the theoretical rates of the boards, and the differences between them:
With the given clockspeeds, the GTX 512MB has 28% more pixel fill-rate and texture sampling rate than the 256MB board, with a 17% increase in geometry performance; the biggest gain is the bandwidth, being increased by nearly 42%. In comparison to the 6800 Ultra the GTX 512MB over double the texture sampling rate and, taking into account the changes to the ALU structure of G70, will translate into an even greater fragment shader throughput. Fill-RatesHere are some of the key fill-rate characteristics of the 7800 GTX 512MB.
The colour fill-rate throughputs are fairly close to the theoretical maximum's, hence the difference between the 512MB and 256MB boards is more or less in-line with the theoretical pixel fill-rate differences. The Z sample rate operates at double the colour fill-rate on all these boards, and we see that the gap between the GTX 512MB and GTX 256MB boards is larger than their theoretical fill-rate differences - this is likely due to the performance here being slightly bandwidth limited with the GTX 256MB and with a higher bandwidth advantage in relation to the fill-rate differences, the GTX 512MB is able to get closer to its theoretical Z fill-rate.
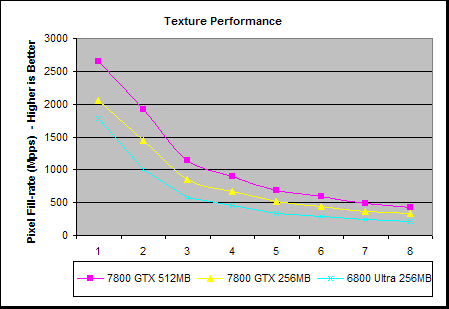
The texturing performance of the GTX 512MB is fairly predicable in relation to the other boards. As expected, the performance difference between the GTX 512MB and the 6800 Ultra is lower than 100% with one texture layer because the 7800's have more texture pipelines than they have outputs, so at one layer it its limited by the output, unlike the 6800 which has a 1-to-1 ratio of texture units to ROP's; once one texture layer is exceeded the difference between these boards rises more towards the theoretical differences between them. |
- NVIDIA Fermi GPU and Architecture Analysis
- ATI Cypress Gaming Performance Analysis
- ATI Cypress GPU and Architecture analysis
- ATI RV740 GPU and Architecture Analysis
- NVIDIA GT200 GPU and Architecture Analysis
- Ian Buck - NVIDIA Tesla Launch
- Andy Keane Interview & Tesla Adoption/Deployment
- Was Harry Potter actually into rendering? Beyond3D's first ever book review
- Dave Kirk - NVIDIA Tesla Launch
- AMD's John Bridgman on Radeon, Linux and Open Source 3D
- Travelling in Style: Beyond3D's C++ AMP contest - WINNER ANNOUNCED
- A speculative look on the Wii U GPU
- Diving into Anti-Aliasing
- E3 2011: Behind Closed Doors - Witcher 2 Xbox 360... and a Nurse
- Q&A with Visceral's Technical Art Director Doug Brooks on Dead Space 2
NVIDIA GeForce 7800 GTX 512MB Review - Page 4
Published on 14th Nov 2005, written by Dave Baumann for Consumer Graphics - Last updated: 29th Jul 2007
Page Navigation
Site width adjust
![]()
![]()
Reset width
Privacy Policy