Serious Sam: Second EncounterFor the final game test we'll look at the OpenGL based title Serious Sam: Second Encounter. In this case we'll use the "The Pit" Custom Firing Squad Demo. 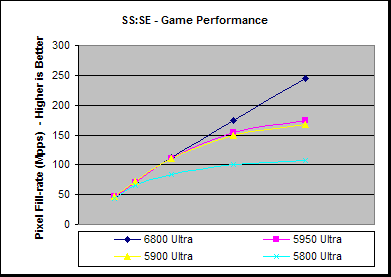
In this SS:SE test we can again see that where other boards are being fill-rate limited, the 6800 Ultra isn't, or at least not as much. Only beyond 1280x1024 does the 6800 Ultra begin to show any performance limitations outside of the system performance, and by this point it has a 40% performance lead over the 5950. 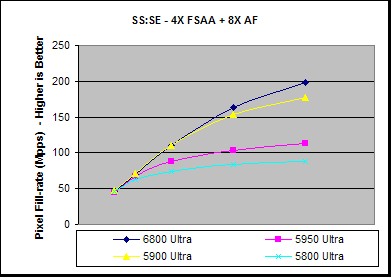
With both 4X FSAA and 8X AD enabled the GeForce 6800 Ultra is beginning to get a little more fill-rate and / or bandwidth limited, but the performance differential between it and the 5950 further opens up to a maximum of 76% 
In all the rendering situations here we see that the average performance of the 6800 Ultra remains over 100 FPS. Even at high resolution there is only a 9% performance drop for enabling 8X AF, 5% for 4X FSAA and 19% for both combined. |
- NVIDIA Fermi GPU and Architecture Analysis
- ATI Cypress Gaming Performance Analysis
- ATI Cypress GPU and Architecture analysis
- ATI RV740 GPU and Architecture Analysis
- NVIDIA GT200 GPU and Architecture Analysis
- A speculative look on the Wii U GPU
- Q&A with Visceral's Technical Art Director Doug Brooks on Dead Space 2
- Diving into Anti-Aliasing
- Travelling in Style: Beyond3D's C++ AMP contest - WINNER ANNOUNCED
- AMD's John Bridgman on Radeon, Linux and Open Source 3D
- E3 2011: Behind Closed Doors - Witcher 2 Xbox 360... and a Nurse
- Ian Buck - NVIDIA Tesla Launch
- Andy Keane Interview & Tesla Adoption/Deployment
- Was Harry Potter actually into rendering? Beyond3D's first ever book review
- Dave Kirk - NVIDIA Tesla Launch
NV40 - GeForce 6800 Ultra Review - Page 27
Published on 14th Apr 2004, written by Dave Baumann for Consumer Graphics - Last updated: 20th Jul 2007
Page Navigation
Site width adjust
![]()
![]()
Reset width
Privacy Policy